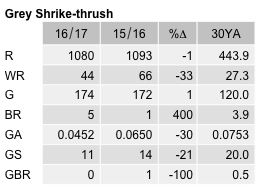
Grey Shrike-thrush
Colluricincla harmonica
ABR description
The following is extracted from the Annual Bird Report for the twelve months to June 2017.
Common, breeding resident
Occurs in a wide variety of habitats in the COG area of interest.
General: 1,794 birds recorded (last year 1,827) though many more than the 10YA (833) and the 30YA (596). Recorded in every week, with a winter (29% of records) and spring (28%) peaks cf lower proportions in summer (23%) and autumn (20%). Reporting rate (7.8%) similar to last year (9.4%) though lower than the 10YA (11.6%) and the 30YA (16.3%). Since 1992 there has been a steady decline in reporting rate from over 20% to well under 8% this year, its lowest level ever. Recorded from 56% of grid cells surveyed, similar to last year (58%), the 10YA (56%) and the 30YA (54%). Max 10/30 Oct Kambah Pool GrI16 (VeP1) (max 18 last year), mean 1.7, median 1. 6 breeding records (1 last year), from rural areas: first dy/10 Oct Lake Road LGeo GrR12 (GaP1) and last cf/15 Feb Farm Dam on Lake Rd LGeo GrR12 (LeM1).
GBS: 116 birds recorded, fewer than last year (189), the 10YA (261) and the 30YA (205). 108 records, fewer than last year (170), the 10YA (210) and the 30YA (174). Recorded in 50 weeks with a higher proportion of records in autumn (28%) and winter (42%) than in spring (16%) and summer (15%). Records from 19% of sites (last year 21%), similar to the 10YA (23%) though lower than the 30YA (31%). Abundance lower than last year, the 10YA (0.0815) and the 30YA (0.0753). Max 3 (4 last year), mean 1.1, median 1. No breeding records (1 last year).
Abundance
Abundance is the average number of birds of that species per survey. Where the species was observed (presence recorded) but the number of birds seen was not recorded, this is treated as a count of zero.
Abundance by year
This chart shows the abundance of Grey Shrike-thrush between 1982 and 2017. 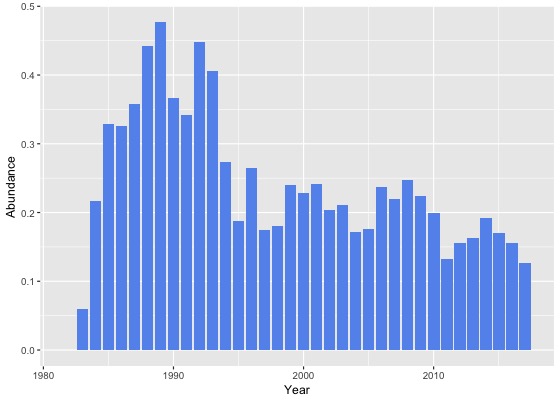
Abundance by month
This chart shows the monthly abundance of Grey Shrike-thrush. The blue lines show the abundance for the twelve months to June 2017 and the bars show the average abundance for the period 1982 to 2017. 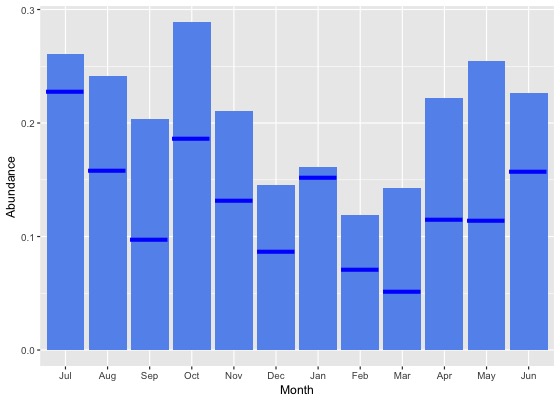
Abundance by season
This chart shows the seasonal abundance of Grey Shrike-thrush. The blue lines show the seasonal abundance for the twelve months to June 2017 and the bars show the average seasonal abundance for the period 1982 to 2017. 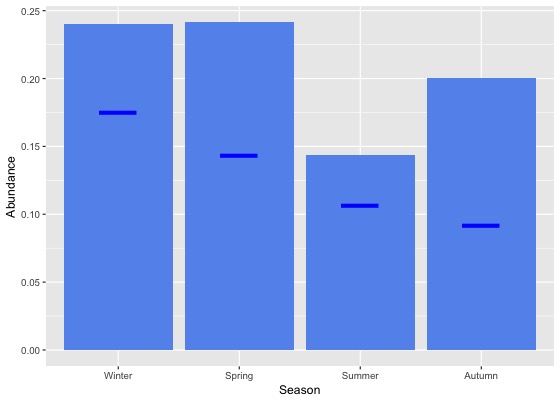
Abundance data
| Month | Season | ||||||||||||||||||
|---|---|---|---|---|---|---|---|---|---|---|---|---|---|---|---|---|---|---|---|
| Period | Jul | Aug | Sep | Oct | Nov | Dec | Jan | Feb | Mar | Apr | May | Jun | Winter | Spring | Summer | Autumn | All | ||
| All years | |||||||||||||||||||
| All | 0.3 | 0.2 | 0.2 | 0.3 | 0.2 | 0.1 | 0.2 | 0.1 | 0.1 | 0.2 | 0.3 | 0.2 | 0.2 | 0.2 | 0.1 | 0.2 | 0.2 | ||
| Previous years | |||||||||||||||||||
| All previous years | 0.3 | 0.3 | 0.2 | 0.3 | 0.2 | 0.2 | 0.2 | 0.1 | 0.2 | 0.2 | 0.3 | 0.2 | 0.3 | 0.3 | 0.2 | 0.2 | 0.2 | ||
| Previous 30 years | 0.3 | 0.3 | 0.2 | 0.3 | 0.2 | 0.2 | 0.2 | 0.1 | 0.2 | 0.2 | 0.3 | 0.2 | 0.3 | 0.3 | 0.1 | 0.2 | 0.2 | ||
| Previous 20 years | 0.2 | 0.2 | 0.2 | 0.3 | 0.2 | 0.1 | 0.1 | 0.1 | 0.1 | 0.2 | 0.2 | 0.2 | 0.2 | 0.2 | 0.1 | 0.2 | 0.2 | ||
| 10 year groups | |||||||||||||||||||
| [2007,2017) | 0.2 | 0.2 | 0.2 | 0.3 | 0.1 | 0.1 | 0.1 | 0.1 | 0.1 | 0.2 | 0.2 | 0.2 | 0.2 | 0.2 | 0.1 | 0.2 | 0.2 | ||
| [1997,2007) | 0.2 | 0.3 | 0.2 | 0.3 | 0.2 | 0.2 | 0.2 | 0.1 | 0.1 | 0.2 | 0.3 | 0.2 | 0.2 | 0.2 | 0.2 | 0.2 | 0.2 | ||
| [1987,1997) | 0.4 | 0.4 | 0.4 | 0.4 | 0.4 | 0.4 | 0.3 | 0.3 | 0.3 | 0.4 | 0.5 | 0.4 | 0.4 | 0.4 | 0.3 | 0.4 | 0.4 | ||
| 5 year groups | |||||||||||||||||||
| [2012,2017) | 0.2 | 0.2 | 0.2 | 0.3 | 0.1 | 0.1 | 0.1 | 0.1 | 0.1 | 0.2 | 0.2 | 0.2 | 0.2 | 0.2 | 0.1 | 0.2 | 0.2 | ||
| [2007,2012) | 0.3 | 0.2 | 0.2 | 0.4 | 0.2 | 0.1 | 0.2 | 0.1 | 0.1 | 0.2 | 0.3 | 0.2 | 0.2 | 0.3 | 0.1 | 0.2 | 0.2 | ||
| [2002,2007) | 0.2 | 0.2 | 0.2 | 0.3 | 0.2 | 0.1 | 0.2 | 0.1 | 0.1 | 0.2 | 0.3 | 0.2 | 0.2 | 0.2 | 0.1 | 0.2 | 0.2 | ||
| [1997,2002) | 0.3 | 0.3 | 0.3 | 0.3 | 0.2 | 0.2 | 0.2 | 0.2 | 0.1 | 0.2 | 0.3 | 0.2 | 0.3 | 0.3 | 0.2 | 0.2 | 0.2 | ||
| [1992,1997) | 0.3 | 0.3 | 0.3 | 0.3 | 0.4 | 0.3 | 0.3 | 0.1 | 0.3 | 0.3 | 0.3 | 0.2 | 0.3 | 0.3 | 0.2 | 0.3 | 0.3 | ||
| [1987,1992) | 0.4 | 0.4 | 0.4 | 0.4 | 0.4 | 0.4 | 0.4 | 0.3 | 0.3 | 0.5 | 0.5 | 0.5 | 0.4 | 0.4 | 0.4 | 0.4 | 0.4 | ||
| Year | |||||||||||||||||||
| 2017 | 0.2 | 0.2 | 0.1 | 0.2 | 0.1 | 0.1 | 0.2 | 0.1 | 0.1 | 0.1 | 0.1 | 0.2 | 0.2 | 0.1 | 0.1 | 0.1 | 0.1 | ||
| 2016 | 0.2 | 0.2 | 0.2 | 0.2 | 0.1 | 0.1 | 0.1 | 0.1 | 0.1 | 0.2 | 0.2 | 0.2 | 0.2 | 0.2 | 0.1 | 0.2 | 0.2 | ||
| 2015 | 0.2 | 0.3 | 0.2 | 0.3 | 0.1 | 0.1 | 0.1 | 0.1 | 0.1 | 0.2 | 0.2 | 0.2 | 0.2 | 0.2 | 0.1 | 0.2 | 0.2 | ||
| 2014 | 0.2 | 0.2 | 0.1 | 0.3 | 0.1 | 0.2 | 0.1 | 0.1 | 0.2 | 0.3 | 0.2 | 0.3 | 0.3 | 0.2 | 0.1 | 0.2 | 0.2 | ||
| 2013 | 0.2 | 0.2 | 0.2 | 0.3 | 0.2 | 0.1 | 0.1 | 0.0 | 0.1 | 0.2 | 0.3 | 0.2 | 0.2 | 0.2 | 0.1 | 0.2 | 0.2 | ||
| 2012 | 0.1 | 0.1 | 0.1 | 0.2 | 0.1 | 0.1 | 0.1 | 0.1 | 0.1 | 0.3 | 0.3 | 0.3 | 0.2 | 0.2 | 0.1 | 0.2 | 0.2 | ||
| 2011 | 0.1 | 0.1 | 0.1 | 0.3 | 0.3 | 0.0 | 0.1 | 0.1 | 0.1 | 0.2 | 0.1 | 0.1 | 0.1 | 0.2 | 0.1 | 0.1 | 0.1 | ||
| 2010 | 0.5 | 0.3 | 0.2 | 0.4 | 0.1 | 0.1 | 0.1 | 0.1 | 0.1 | 0.2 | 0.2 | 0.1 | 0.2 | 0.3 | 0.1 | 0.1 | 0.2 | ||
| 2009 | 0.2 | 0.2 | 0.1 | 0.4 | 0.2 | 0.1 | 0.1 | 0.2 | 0.1 | 0.2 | 0.3 | 0.2 | 0.2 | 0.3 | 0.1 | 0.2 | 0.2 | ||
| 2008 | 0.3 | 0.2 | 0.2 | 0.3 | 0.3 | 0.1 | 0.3 | 0.2 | 0.2 | 0.2 | 0.5 | 0.2 | 0.2 | 0.3 | 0.2 | 0.2 | 0.2 | ||
| 2007 | 0.2 | 0.3 | 0.1 | 0.4 | 0.1 | 0.1 | 0.1 | 0.1 | 0.1 | 0.3 | 0.3 | 0.3 | 0.3 | 0.3 | 0.1 | 0.2 | 0.2 | ||
| 2006 | 0.1 | 0.2 | 0.2 | 0.4 | 0.3 | 0.2 | 0.2 | 0.1 | 0.1 | 0.2 | 0.3 | 0.3 | 0.2 | 0.3 | 0.2 | 0.2 | 0.2 | ||
| 2005 | 0.2 | 0.2 | 0.2 | 0.3 | 0.2 | 0.2 | 0.3 | 0.2 | 0.1 | 0.1 | 0.2 | 0.2 | 0.2 | 0.2 | 0.2 | 0.1 | 0.2 | ||
| 2004 | 0.2 | 0.1 | 0.2 | 0.2 | 0.3 | 0.1 | 0.2 | 0.2 | 0.1 | 0.2 | 0.2 | 0.2 | 0.1 | 0.2 | 0.1 | 0.2 | 0.2 | ||
| 2003 | 0.4 | 0.3 | 0.3 | 0.2 | 0.1 | 0.1 | 0.1 | 0.1 | 0.2 | 0.3 | 0.4 | 0.2 | 0.3 | 0.2 | 0.1 | 0.3 | 0.2 | ||
| 2002 | 0.3 | 0.3 | 0.2 | 0.2 | 0.3 | 0.1 | 0.1 | 0.1 | 0.2 | 0.1 | 0.2 | 0.3 | 0.3 | 0.2 | 0.1 | 0.2 | 0.2 | ||
| 2001 | 0.3 | 0.2 | 0.2 | 0.3 | 0.2 | 0.3 | 0.2 | 0.2 | 0.1 | 0.2 | 0.4 | 0.3 | 0.3 | 0.3 | 0.2 | 0.2 | 0.2 | ||
| 2000 | 0.3 | 0.4 | 0.3 | 0.2 | 0.3 | 0.1 | 0.2 | 0.2 | 0.2 | 0.2 | 0.3 | 0.3 | 0.3 | 0.3 | 0.2 | 0.2 | 0.2 | ||
| 1999 | 0.2 | 0.5 | 0.3 | 0.3 | 0.4 | 0.2 | 0.3 | 0.2 | 0.1 | 0.2 | 0.2 | 0.2 | 0.3 | 0.3 | 0.2 | 0.2 | 0.2 | ||
| 1998 | 0.0 | 0.2 | 0.3 | 0.3 | 0.1 | 0.0 | 0.2 | 0.2 | 0.1 | 0.2 | 0.2 | 0.2 | 0.1 | 0.3 | 0.1 | 0.1 | 0.2 | ||
| 1997 | 0.3 | 0.2 | 0.2 | 0.2 | 0.1 | 0.2 | 0.3 | 0.0 | 0.3 | 0.2 | 0.1 | 0.2 | 0.2 | 0.1 | 0.2 | 0.2 | 0.2 | ||
| 1996 | 0.4 | 0.2 | 0.4 | 0.3 | 0.4 | 0.3 | 0.2 | 0.2 | 0.2 | 0.2 | 0.3 | 0.2 | 0.2 | 0.4 | 0.2 | 0.2 | 0.3 | ||
| 1995 | 0.2 | 0.2 | 0.2 | 0.2 | 0.3 | 0.1 | 0.2 | 0.0 | 0.1 | 0.2 | 0.3 | 0.2 | 0.2 | 0.2 | 0.1 | 0.2 | 0.2 | ||
| 1994 | 0.4 | 0.5 | 0.2 | 0.3 | 0.2 | 0.4 | 0.3 | 0.2 | 0.2 | 0.3 | 0.2 | 0.2 | 0.4 | 0.2 | 0.3 | 0.2 | 0.3 | ||
| 1993 | 0.1 | 0.6 | 0.5 | 0.2 | 0.5 | 0.3 | 0.7 | 0.1 | 0.7 | 0.4 | 0.4 | 0.3 | 0.4 | 0.4 | 0.4 | 0.5 | 0.4 | ||
| 1992 | 0.4 | 0.3 | 0.4 | 0.7 | 0.8 | 0.3 | 0.2 | 0.2 | 0.4 | 0.8 | 0.6 | 0.1 | 0.3 | 0.6 | 0.3 | 0.5 | 0.4 | ||
| 1991 | 0.2 | 0.3 | 0.3 | 0.3 | 0.5 | 0.2 | 0.2 | 0.2 | 0.3 | 0.9 | 0.6 | 0.4 | 0.3 | 0.4 | 0.2 | 0.6 | 0.3 | ||
| 1990 | 0.5 | 0.4 | 0.4 | 0.2 | 0.2 | 0.3 | 0.4 | 0.2 | 0.1 | 0.6 | 0.6 | 0.4 | 0.4 | 0.3 | 0.3 | 0.4 | 0.4 | ||
| 1989 | 0.6 | 0.4 | 0.5 | 0.5 | 0.4 | 0.5 | 0.5 | 0.4 | 0.4 | 0.5 | 0.5 | 0.5 | 0.5 | 0.5 | 0.4 | 0.5 | 0.5 | ||
| 1988 | 0.4 | 0.5 | 0.4 | 0.5 | 0.4 | 0.5 | 0.4 | 0.4 | 0.5 | 0.4 | 0.6 | 0.5 | 0.5 | 0.4 | 0.4 | 0.5 | 0.4 | ||
| 1987 | 0.3 | 0.1 | 0.4 | 0.3 | 0.4 | 0.4 | 0.3 | 0.3 | 0.3 | 0.4 | 0.4 | 0.4 | 0.4 | 0.4 | 0.3 | 0.4 | 0.4 | ||
| 1986 | 0.3 | 0.3 | 0.4 | 0.2 | 0.2 | 0.5 | 0.3 | 0.3 | 0.3 | 0.4 | 0.4 | 0.3 | 0.3 | 0.3 | 0.4 | 0.4 | 0.3 | ||
| 1985 | 0.3 | 0.1 | 0.2 | 0.5 | 0.3 | 0.4 | 0.4 | 0.4 | 0.1 | 0.2 | 0.2 | 0.2 | 0.2 | 0.4 | 0.4 | 0.2 | 0.3 | ||
| 1984 | 0.0 | 0.0 | 0.0 | 0.0 | 0.0 | 0.0 | 0.4 | 0.1 | 0.7 | 0.1 | 0.4 | 0.1 | 0.0 | 0.0 | 0.2 | 0.4 | 0.2 | ||
| 1983 | 0.0 | 0.0 | 0.0 | 0.1 | 0.3 | 0.2 | 0.0 | 0.0 | 0.0 | - | 0.0 | 0.0 | 0.0 | 0.1 | 0.1 | 0.0 | 0.1 | ||
| 1982 | - | 0.0 | - | 0.0 | 0.0 | 0.0 | - | 0.0 | - | 0.0 | - | 0.0 | 0.0 | 0.0 | 0.0 | 0.0 | 0.0 | ||
Reporting rates
Reporting rate is the proportion of all surveys in which the species was present.
Reporting rate by year
This chart shows the reporting rate of Grey Shrike-thrush each year between 1982 and 2017. 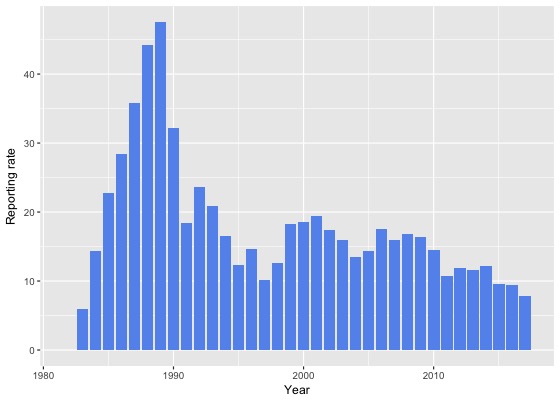
Reporting rate by month
This chart shows the reporting rate by month of Grey Shrike-thrush. The blue lines show the reporting rate for the twelve months to June 2017 and the bars show the average reporting rate for the period 1982 to 2017. 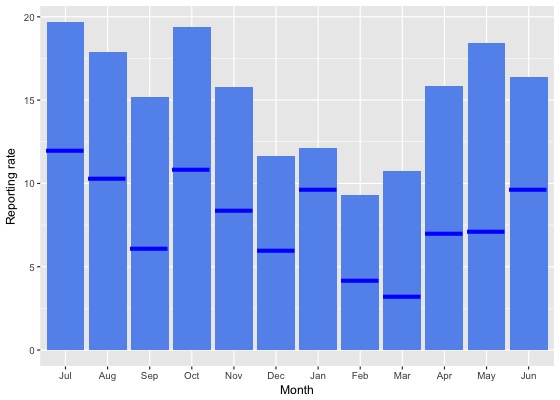
Reporting rate by season
This chart shows the seasonal reporting rate of Grey Shrike-thrush. The blue lines show the seasonal reporting rate for the twelve months to June 2017 and the bars show the average seasonal reporting rate for the period 1982 to 2017. 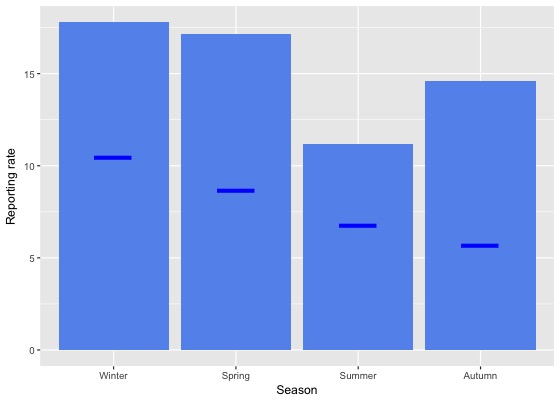
Reporting rate data
| Month | Season | ||||||||||||||||||
|---|---|---|---|---|---|---|---|---|---|---|---|---|---|---|---|---|---|---|---|
| Period | Jul | Aug | Sep | Oct | Nov | Dec | Jan | Feb | Mar | Apr | May | Jun | Winter | Spring | Summer | Autumn | All | ||
| All years | |||||||||||||||||||
| All | 19.7 | 17.9 | 15.2 | 19.4 | 15.8 | 11.7 | 12.2 | 9.3 | 10.7 | 15.9 | 18.4 | 16.4 | 17.8 | 17.1 | 11.2 | 14.6 | 15.1 | ||
| Previous years | |||||||||||||||||||
| All previous years | 20.8 | 19.4 | 16.5 | 20.6 | 17.0 | 12.5 | 12.6 | 10.4 | 12.1 | 17.3 | 21.1 | 17.7 | 19.1 | 18.3 | 12.0 | 16.3 | 16.4 | ||
| Previous 30 years | 20.8 | 19.5 | 16.4 | 20.5 | 16.9 | 12.4 | 12.5 | 10.4 | 11.9 | 17.3 | 20.9 | 17.8 | 19.2 | 18.3 | 11.9 | 16.1 | 16.3 | ||
| Previous 20 years | 16.8 | 15.4 | 13.4 | 18.7 | 12.6 | 8.7 | 9.8 | 7.5 | 9.1 | 14.2 | 16.3 | 14.7 | 15.5 | 15.5 | 8.8 | 12.7 | 13.1 | ||
| 10 year groups | |||||||||||||||||||
| [2007,2017) | 15.3 | 13.8 | 11.4 | 18.1 | 10.3 | 6.8 | 8.5 | 5.9 | 7.8 | 13.2 | 14.2 | 13.0 | 13.8 | 14.3 | 7.2 | 11.4 | 11.6 | ||
| [1997,2007) | 19.4 | 19.1 | 17.5 | 20.8 | 17.1 | 12.4 | 14.2 | 11.4 | 11.9 | 16.7 | 21.4 | 18.2 | 18.8 | 18.5 | 12.7 | 15.8 | 16.5 | ||
| [1987,1997) | 34.9 | 31.6 | 31.7 | 30.9 | 31.4 | 32.8 | 28.3 | 24.1 | 27.6 | 33.1 | 38.2 | 33.3 | 33.2 | 31.3 | 28.5 | 32.8 | 31.5 | ||
| 5 year groups | |||||||||||||||||||
| [2012,2017) | 14.5 | 13.3 | 10.7 | 15.2 | 8.1 | 6.0 | 7.2 | 4.7 | 7.7 | 12.9 | 13.1 | 14.1 | 14.0 | 12.0 | 6.1 | 10.9 | 10.4 | ||
| [2007,2012) | 17.5 | 15.4 | 13.0 | 23.1 | 16.4 | 8.6 | 13.1 | 11.1 | 8.2 | 14.0 | 17.5 | 11.1 | 13.6 | 19.0 | 10.7 | 12.7 | 14.6 | ||
| [2002,2007) | 17.9 | 18.7 | 17.4 | 21.2 | 17.2 | 11.5 | 12.1 | 10.9 | 11.3 | 15.6 | 20.4 | 16.9 | 17.7 | 18.7 | 11.5 | 14.9 | 15.8 | ||
| [1997,2002) | 21.8 | 19.5 | 17.7 | 20.3 | 17.0 | 13.5 | 16.5 | 11.9 | 12.8 | 18.0 | 22.6 | 20.0 | 20.4 | 18.3 | 14.0 | 17.0 | 17.3 | ||
| [1992,1997) | 18.8 | 16.2 | 17.8 | 17.3 | 19.3 | 16.7 | 15.9 | 10.0 | 16.4 | 18.7 | 17.9 | 14.8 | 16.4 | 18.1 | 14.5 | 17.7 | 16.8 | ||
| [1987,1992) | 42.2 | 40.1 | 38.3 | 38.3 | 37.1 | 39.8 | 35.2 | 29.5 | 34.2 | 41.3 | 48.7 | 43.8 | 41.9 | 37.9 | 34.9 | 41.3 | 38.9 | ||
| Year | |||||||||||||||||||
| 2017 | 12.0 | 10.3 | 6.1 | 10.8 | 8.4 | 6.0 | 9.7 | 4.2 | 3.2 | 7.0 | 7.1 | 9.7 | 10.5 | 8.7 | 6.8 | 5.7 | 7.8 | ||
| 2016 | 13.4 | 11.6 | 10.4 | 13.3 | 8.0 | 4.7 | 6.9 | 5.1 | 7.8 | 10.3 | 10.8 | 11.9 | 12.2 | 11.0 | 5.7 | 9.5 | 9.4 | ||
| 2015 | 14.0 | 15.0 | 10.8 | 12.9 | 7.6 | 5.5 | 7.2 | 3.7 | 7.5 | 10.9 | 10.6 | 12.0 | 13.3 | 10.8 | 5.6 | 9.6 | 9.5 | ||
| 2014 | 19.4 | 15.5 | 10.6 | 17.9 | 7.0 | 9.9 | 7.6 | 5.8 | 9.7 | 16.9 | 13.6 | 17.0 | 17.0 | 13.5 | 7.5 | 13.0 | 12.2 | ||
| 2013 | 16.8 | 17.2 | 12.5 | 19.4 | 11.5 | 6.0 | 5.5 | 3.8 | 6.1 | 16.0 | 19.2 | 14.4 | 16.0 | 15.3 | 5.3 | 12.4 | 11.7 | ||
| 2012 | 13.0 | 10.2 | 9.5 | 15.8 | 6.3 | 7.0 | 9.0 | 5.4 | 7.1 | 17.1 | 22.5 | 19.9 | 14.9 | 11.9 | 7.7 | 14.4 | 11.9 | ||
| 2011 | 10.6 | 7.2 | 8.5 | 16.6 | 18.8 | 5.1 | 13.0 | 9.1 | 5.6 | 13.5 | 11.6 | 6.7 | 7.6 | 14.7 | 9.1 | 10.2 | 10.7 | ||
| 2010 | 27.1 | 19.3 | 16.9 | 24.0 | 12.0 | 9.5 | 12.1 | 9.4 | 7.5 | 11.5 | 13.7 | 8.8 | 15.0 | 19.3 | 10.4 | 10.2 | 14.5 | ||
| 2009 | 15.8 | 15.6 | 10.9 | 26.3 | 20.5 | 9.5 | 12.7 | 10.0 | 11.6 | 14.8 | 17.6 | 12.6 | 14.2 | 21.1 | 10.7 | 14.2 | 16.4 | ||
| 2008 | 21.4 | 18.3 | 15.7 | 22.5 | 17.4 | 7.7 | 21.4 | 17.6 | 10.8 | 11.2 | 27.0 | 12.6 | 16.7 | 19.9 | 13.8 | 13.9 | 16.8 | ||
| 2007 | 13.2 | 17.6 | 12.9 | 26.0 | 12.8 | 11.7 | 10.2 | 11.3 | 7.2 | 20.5 | 25.2 | 16.0 | 15.8 | 19.9 | 11.1 | 16.2 | 16.0 | ||
| 2006 | 13.2 | 18.4 | 12.3 | 29.4 | 21.4 | 11.7 | 16.3 | 14.8 | 11.4 | 14.5 | 21.7 | 18.0 | 16.7 | 22.8 | 14.2 | 14.4 | 17.5 | ||
| 2005 | 14.7 | 14.0 | 16.7 | 19.3 | 11.7 | 13.1 | 16.3 | 15.2 | 6.1 | 9.8 | 20.4 | 15.3 | 14.9 | 16.3 | 14.5 | 11.9 | 14.3 | ||
| 2004 | 12.7 | 12.5 | 16.8 | 16.3 | 19.8 | 10.6 | 12.7 | 9.1 | 7.8 | 15.4 | 15.5 | 11.7 | 12.3 | 17.6 | 11.0 | 12.3 | 13.4 | ||
| 2003 | 29.1 | 23.7 | 21.2 | 15.0 | 13.8 | 8.9 | 5.2 | 6.6 | 12.6 | 22.1 | 23.3 | 16.8 | 22.5 | 16.8 | 7.2 | 18.6 | 16.0 | ||
| 2002 | 24.6 | 25.4 | 19.9 | 17.6 | 19.0 | 12.7 | 8.8 | 11.2 | 18.2 | 14.9 | 20.0 | 22.6 | 24.0 | 18.8 | 11.4 | 17.3 | 17.4 | ||
| 2001 | 25.3 | 21.7 | 17.8 | 23.1 | 16.5 | 20.7 | 13.5 | 17.0 | 12.7 | 19.0 | 26.6 | 23.6 | 23.7 | 19.2 | 17.5 | 17.9 | 19.4 | ||
| 2000 | 29.4 | 22.2 | 15.8 | 22.9 | 21.3 | 9.0 | 17.8 | 11.0 | 17.1 | 20.4 | 25.5 | 22.6 | 24.3 | 20.1 | 12.4 | 20.0 | 18.5 | ||
| 1999 | 20.6 | 20.6 | 22.4 | 20.1 | 21.4 | 16.2 | 19.7 | 12.1 | 10.8 | 20.1 | 19.3 | 18.7 | 19.4 | 21.4 | 16.0 | 16.8 | 18.3 | ||
| 1998 | 2.7 | 11.3 | 22.0 | 12.0 | 14.2 | 5.7 | 14.7 | 5.7 | 6.5 | 17.9 | 29.6 | 13.3 | 10.3 | 16.5 | 8.4 | 13.2 | 12.6 | ||
| 1997 | 10.3 | 12.1 | 9.1 | 14.5 | 6.8 | 11.5 | 15.7 | 3.5 | 12.5 | 7.3 | 8.9 | 13.9 | 12.0 | 9.6 | 10.4 | 8.8 | 10.2 | ||
| 1996 | 17.9 | 11.7 | 24.0 | 13.2 | 17.6 | 18.2 | 9.7 | 11.8 | 11.8 | 14.1 | 8.6 | 17.2 | 15.3 | 17.5 | 13.2 | 11.6 | 14.6 | ||
| 1995 | 12.9 | 9.3 | 11.7 | 10.4 | 11.8 | 9.2 | 16.8 | 1.6 | 13.3 | 13.7 | 18.2 | 17.0 | 12.7 | 11.1 | 10.6 | 14.7 | 12.3 | ||
| 1994 | 21.6 | 19.5 | 19.1 | 24.4 | 14.0 | 26.1 | 16.2 | 12.1 | 9.1 | 17.6 | 10.0 | 15.7 | 18.4 | 18.3 | 17.4 | 13.0 | 16.6 | ||
| 1993 | 14.3 | 25.6 | 16.1 | 14.7 | 27.3 | 15.2 | 22.4 | 12.5 | 34.6 | 21.7 | 19.5 | 15.9 | 19.4 | 19.2 | 17.3 | 25.7 | 20.8 | ||
| 1992 | 29.2 | 22.2 | 20.0 | 29.8 | 36.1 | 19.0 | 19.0 | 14.6 | 15.5 | 33.9 | 31.6 | 5.0 | 19.0 | 28.3 | 17.9 | 26.7 | 23.7 | ||
| 1991 | 14.2 | 11.7 | 14.0 | 17.5 | 24.7 | 9.5 | 10.7 | 8.0 | 25.4 | 40.7 | 27.9 | 26.0 | 15.5 | 18.9 | 9.4 | 31.1 | 18.5 | ||
| 1990 | 48.4 | 44.9 | 36.6 | 22.4 | 23.4 | 33.3 | 34.7 | 18.3 | 11.4 | 27.4 | 37.0 | 22.4 | 42.1 | 27.2 | 28.8 | 24.5 | 32.2 | ||
| 1989 | 60.2 | 40.5 | 53.3 | 51.2 | 39.4 | 50.0 | 46.8 | 35.1 | 42.8 | 48.2 | 54.6 | 47.6 | 49.0 | 48.5 | 44.3 | 48.2 | 47.5 | ||
| 1988 | 38.8 | 46.6 | 35.4 | 46.1 | 39.8 | 44.1 | 36.2 | 38.9 | 45.5 | 44.4 | 61.1 | 53.6 | 46.1 | 40.9 | 39.7 | 50.4 | 44.2 | ||
| 1987 | 27.3 | 33.3 | 35.6 | 32.0 | 41.5 | 37.4 | 30.3 | 25.8 | 28.2 | 38.3 | 43.2 | 43.1 | 41.7 | 36.9 | 31.0 | 36.9 | 35.7 | ||
| 1986 | 30.8 | 28.9 | 32.1 | 19.4 | 17.0 | 26.5 | 30.4 | 16.7 | 22.6 | 39.2 | 44.8 | 34.3 | 31.3 | 23.5 | 23.7 | 36.0 | 28.5 | ||
| 1985 | 20.0 | 10.0 | 13.5 | 33.7 | 26.3 | 28.3 | 12.5 | 11.8 | 9.1 | 10.5 | 40.0 | 21.4 | 17.0 | 26.2 | 23.5 | 17.5 | 22.8 | ||
| 1984 | 0.0 | 0.0 | 0.0 | 0.0 | 0.0 | 0.0 | 31.0 | 12.1 | 40.7 | 5.9 | 22.6 | 2.9 | 2.0 | 0.0 | 17.6 | 21.7 | 14.4 | ||
| 1983 | 0.0 | 0.0 | 0.0 | 7.7 | 33.3 | 15.4 | 0.0 | 0.0 | 0.0 | - | 0.0 | 0.0 | 0.0 | 14.8 | 6.7 | 0.0 | 6.0 | ||
| 1982 | - | 0.0 | - | 0.0 | 0.0 | 0.0 | - | 0.0 | - | 0.0 | - | 0.0 | 0.0 | 0.0 | 0.0 | 0.0 | 0.0 | ||
Breeding data
Breeding records by month
Number of breeding records by breeding code and month, 2017 and all years| Breeding code | Jul | Aug | Sep | Oct | Nov | Dec | Jan | Feb | Mar | Apr | May | Jun |
|---|---|---|---|---|---|---|---|---|---|---|---|---|
| 2017 | ||||||||||||
| Breeding (BLA code) | 0 | 0 | 0 | 0 | 0 | 0 | 0 | 0 | 0 | 0 | 0 | 0 |
| Carrying Food | 0 | 0 | 0 | 0 | 0 | 1 | 0 | 1 | 0 | 0 | 0 | 0 |
| Copulating | 0 | 0 | 0 | 0 | 0 | 0 | 0 | 0 | 0 | 0 | 0 | 0 |
| Display | 0 | 0 | 0 | 0 | 0 | 0 | 0 | 1 | 0 | 0 | 0 | 0 |
| Dependent young | 0 | 0 | 0 | 1 | 0 | 0 | 0 | 1 | 0 | 0 | 0 | 0 |
| Faecal sac | 0 | 0 | 0 | 0 | 0 | 0 | 0 | 0 | 0 | 0 | 0 | 0 |
| Inspecting hollow | 0 | 0 | 0 | 0 | 0 | 0 | 0 | 0 | 0 | 0 | 0 | 0 |
| Nest building | 0 | 0 | 0 | 1 | 0 | 0 | 0 | 0 | 0 | 0 | 0 | 0 |
| Nest with eggs | 0 | 0 | 0 | 0 | 0 | 0 | 0 | 0 | 0 | 0 | 0 | 0 |
| Nest with young | 0 | 0 | 0 | 0 | 0 | 0 | 0 | 0 | 0 | 0 | 0 | 0 |
| On/leaving nest | 0 | 0 | 0 | 0 | 0 | 0 | 0 | 0 | 0 | 0 | 0 | 0 |
| All years | ||||||||||||
| Breeding (BLA code) | 0 | 0 | 0 | 2 | 2 | 2 | 0 | 0 | 0 | 0 | 0 | 0 |
| Carrying Food | 0 | 0 | 1 | 6 | 5 | 2 | 1 | 3 | 0 | 0 | 0 | 0 |
| Copulating | 0 | 0 | 0 | 0 | 0 | 0 | 0 | 0 | 0 | 0 | 0 | 0 |
| Display | 0 | 1 | 0 | 0 | 0 | 0 | 0 | 1 | 0 | 0 | 0 | 0 |
| Dependent young | 0 | 0 | 0 | 6 | 6 | 14 | 9 | 8 | 2 | 2 | 1 | 0 |
| Faecal sac | 0 | 0 | 0 | 0 | 0 | 0 | 0 | 0 | 0 | 0 | 0 | 0 |
| Inspecting hollow | 1 | 0 | 0 | 0 | 0 | 0 | 0 | 0 | 0 | 0 | 0 | 0 |
| Nest building | 1 | 2 | 3 | 6 | 2 | 2 | 1 | 1 | 0 | 0 | 0 | 0 |
| Nest with eggs | 0 | 1 | 0 | 2 | 4 | 2 | 0 | 0 | 0 | 0 | 0 | 0 |
| Nest with young | 0 | 0 | 0 | 2 | 5 | 3 | 2 | 0 | 0 | 0 | 0 | 0 |
| On/leaving nest | 0 | 1 | 0 | 3 | 3 | 3 | 0 | 0 | 0 | 0 | 0 | 0 |
Breeding records by year
Average number of breeding records per period by breeding code| Period | Breeding (BLA code) | Carrying Food | Copulating | Display | Dependent young | Faecal sac | Inspecting hollow | Nest building | Nest with eggs | Nest with young | On/leaving nest |
|---|---|---|---|---|---|---|---|---|---|---|---|
| All years | |||||||||||
| All | 0.2 | 0.5 | 0.0 | 0.1 | 1.3 | 0.0 | 0.0 | 0.5 | 0.2 | 0.3 | 0.3 |
| Previous years | |||||||||||
| All previous years | 0.2 | 0.5 | 0.0 | 0.0 | 1.3 | 0.0 | 0.0 | 0.5 | 0.3 | 0.3 | 0.3 |
| Previous 30 years | 0.2 | 0.5 | 0.0 | 0.0 | 1.5 | 0.0 | 0.0 | 0.6 | 0.3 | 0.4 | 0.3 |
| Previous 20 years | 0.3 | 0.5 | 0.0 | 0.0 | 1.1 | 0.0 | 0.0 | 0.3 | 0.0 | 0.5 | 0.3 |
| 10 year groups | |||||||||||
| [2007,2017) | 0.2 | 0.7 | 0.0 | 0.1 | 0.9 | 0.0 | 0.0 | 0.3 | 0.0 | 0.2 | 0.3 |
| [1997,2007) | 0.4 | 0.2 | 0.0 | 0.0 | 1.4 | 0.0 | 0.1 | 0.4 | 0.0 | 0.7 | 0.4 |
| [1987,1997) | 0.0 | 0.7 | 0.0 | 0.0 | 2.2 | 0.0 | 0.0 | 1.0 | 0.9 | 0.2 | 0.3 |
| 5 year groups | |||||||||||
| [2012,2017) | 0.2 | 0.8 | 0.0 | 0.0 | 1.4 | 0.0 | 0.0 | 0.2 | 0.0 | 0.2 | 0.0 |
| [2007,2012) | 0.2 | 0.6 | 0.0 | 0.2 | 0.4 | 0.0 | 0.0 | 0.4 | 0.0 | 0.2 | 0.6 |
| [2002,2007) | 0.4 | 0.4 | 0.0 | 0.0 | 1.4 | 0.0 | 0.2 | 0.2 | 0.0 | 0.8 | 0.4 |
| [1997,2002) | 0.4 | 0.0 | 0.0 | 0.0 | 1.4 | 0.0 | 0.0 | 0.6 | 0.0 | 0.6 | 0.4 |
| [1992,1997) | 0.0 | 0.0 | 0.0 | 0.0 | 0.0 | 0.0 | 0.0 | 0.6 | 0.2 | 0.0 | 0.4 |
| [1987,1992) | 0.0 | 1.4 | 0.0 | 0.0 | 4.4 | 0.0 | 0.0 | 1.4 | 1.6 | 0.4 | 0.2 |
| Year | |||||||||||
| 2017 | 0.0 | 2.0 | 0.0 | 1.0 | 2.0 | 0.0 | 0.0 | 1.0 | 0.0 | 0.0 | 0.0 |
| 2016 | 0.0 | 0.0 | 0.0 | 0.0 | 0.0 | 0.0 | 0.0 | 0.0 | 0.0 | 1.0 | 0.0 |
| 2015 | 0.0 | 2.0 | 0.0 | 0.0 | 0.0 | 0.0 | 0.0 | 1.0 | 0.0 | 0.0 | 0.0 |
| 2014 | 0.0 | 1.0 | 0.0 | 0.0 | 6.0 | 0.0 | 0.0 | 0.0 | 0.0 | 0.0 | 0.0 |
| 2013 | 0.0 | 0.0 | 0.0 | 0.0 | 0.0 | 0.0 | 0.0 | 0.0 | 0.0 | 0.0 | 0.0 |
| 2012 | 1.0 | 1.0 | 0.0 | 0.0 | 1.0 | 0.0 | 0.0 | 0.0 | 0.0 | 0.0 | 0.0 |
| 2011 | 0.0 | 1.0 | 0.0 | 0.0 | 1.0 | 0.0 | 0.0 | 0.0 | 0.0 | 0.0 | 0.0 |
| 2010 | 0.0 | 0.0 | 0.0 | 0.0 | 0.0 | 0.0 | 0.0 | 0.0 | 0.0 | 1.0 | 1.0 |
| 2009 | 0.0 | 0.0 | 0.0 | 0.0 | 1.0 | 0.0 | 0.0 | 1.0 | 0.0 | 0.0 | 1.0 |
| 2008 | 0.0 | 1.0 | 0.0 | 1.0 | 0.0 | 0.0 | 0.0 | 1.0 | 0.0 | 0.0 | 1.0 |
| 2007 | 1.0 | 1.0 | 0.0 | 0.0 | 0.0 | 0.0 | 0.0 | 0.0 | 0.0 | 0.0 | 0.0 |
| 2006 | 0.0 | 0.0 | 0.0 | 0.0 | 5.0 | 0.0 | 0.0 | 0.0 | 0.0 | 1.0 | 1.0 |
| 2005 | 0.0 | 1.0 | 0.0 | 0.0 | 0.0 | 0.0 | 0.0 | 0.0 | 0.0 | 2.0 | 0.0 |
| 2004 | 0.0 | 0.0 | 0.0 | 0.0 | 1.0 | 0.0 | 0.0 | 1.0 | 0.0 | 1.0 | 1.0 |
| 2003 | 0.0 | 0.0 | 0.0 | 0.0 | 0.0 | 0.0 | 0.0 | 0.0 | 0.0 | 0.0 | 0.0 |
| 2002 | 2.0 | 1.0 | 0.0 | 0.0 | 1.0 | 0.0 | 1.0 | 0.0 | 0.0 | 0.0 | 0.0 |
| 2001 | 0.0 | 0.0 | 0.0 | 0.0 | 1.0 | 0.0 | 0.0 | 1.0 | 0.0 | 0.0 | 0.0 |
| 2000 | 1.0 | 0.0 | 0.0 | 0.0 | 2.0 | 0.0 | 0.0 | 0.0 | 0.0 | 1.0 | 0.0 |
| 1999 | 1.0 | 0.0 | 0.0 | 0.0 | 3.0 | 0.0 | 0.0 | 1.0 | 0.0 | 0.0 | 2.0 |
| 1998 | 0.0 | 0.0 | 0.0 | 0.0 | 1.0 | 0.0 | 0.0 | 1.0 | 0.0 | 0.0 | 0.0 |
| 1997 | 0.0 | 0.0 | 0.0 | 0.0 | 0.0 | 0.0 | 0.0 | 0.0 | 0.0 | 2.0 | 0.0 |
| 1996 | 0.0 | 0.0 | 0.0 | 0.0 | 0.0 | 0.0 | 0.0 | 0.0 | 1.0 | 0.0 | 2.0 |
| 1995 | 0.0 | 0.0 | 0.0 | 0.0 | 0.0 | 0.0 | 0.0 | 1.0 | 0.0 | 0.0 | 0.0 |
| 1994 | 0.0 | 0.0 | 0.0 | 0.0 | 0.0 | 0.0 | 0.0 | 1.0 | 0.0 | 0.0 | 0.0 |
| 1993 | 0.0 | 0.0 | 0.0 | 0.0 | 0.0 | 0.0 | 0.0 | 0.0 | 0.0 | 0.0 | 0.0 |
| 1992 | 0.0 | 0.0 | 0.0 | 0.0 | 0.0 | 0.0 | 0.0 | 1.0 | 0.0 | 0.0 | 0.0 |
| 1991 | 0.0 | 1.0 | 0.0 | 0.0 | 0.0 | 0.0 | 0.0 | 0.0 | 0.0 | 0.0 | 0.0 |
| 1990 | 0.0 | 0.0 | 0.0 | 0.0 | 1.0 | 0.0 | 0.0 | 0.0 | 0.0 | 0.0 | 0.0 |
| 1989 | 0.0 | 4.0 | 0.0 | 0.0 | 8.0 | 0.0 | 0.0 | 5.0 | 3.0 | 0.0 | 1.0 |
| 1988 | 0.0 | 1.0 | 0.0 | 0.0 | 9.0 | 0.0 | 0.0 | 2.0 | 3.0 | 1.0 | 0.0 |
| 1987 | 0.0 | 1.0 | 0.0 | 0.0 | 4.0 | 0.0 | 0.0 | 0.0 | 2.0 | 1.0 | 0.0 |
| 1986 | 0.0 | 0.0 | 0.0 | 0.0 | 0.0 | 0.0 | 0.0 | 0.0 | 0.0 | 0.0 | 0.0 |
| 1985 | 0.0 | 0.0 | 0.0 | 0.0 | 1.0 | 0.0 | 0.0 | 0.0 | 0.0 | 1.0 | 0.0 |
| 1984 | 0.0 | 0.0 | 0.0 | 0.0 | 0.0 | 0.0 | 0.0 | 0.0 | 0.0 | 0.0 | 0.0 |
| 1983 | 0.0 | 0.0 | 0.0 | 0.0 | 0.0 | 0.0 | 0.0 | 0.0 | 0.0 | 0.0 | 0.0 |
| 1982 | 0.0 | 0.0 | 0.0 | 0.0 | 0.0 | 0.0 | 0.0 | 0.0 | 0.0 | 0.0 | 0.0 |
Distribution map
Distribution - 2017
This map shows the observed distribution of the Grey Shrike-thrush for 2017.
The red circles are the grid cells where Grey Shrike-thrush have been reported.
The transparency of the red circles indicate how many surveys sheets were submitted for that grid cell; the darker the red the more reliable the data. Of the 315 grid cells with reports, 83 had only one sheet; an example is grid number A9.
The size of the circle represents the reporting rate. The maximum reporting rate for Grey Shrike-thrush was 100.0% (eg grid number A9) and the minimum was 0.3% (eg grid number L12). 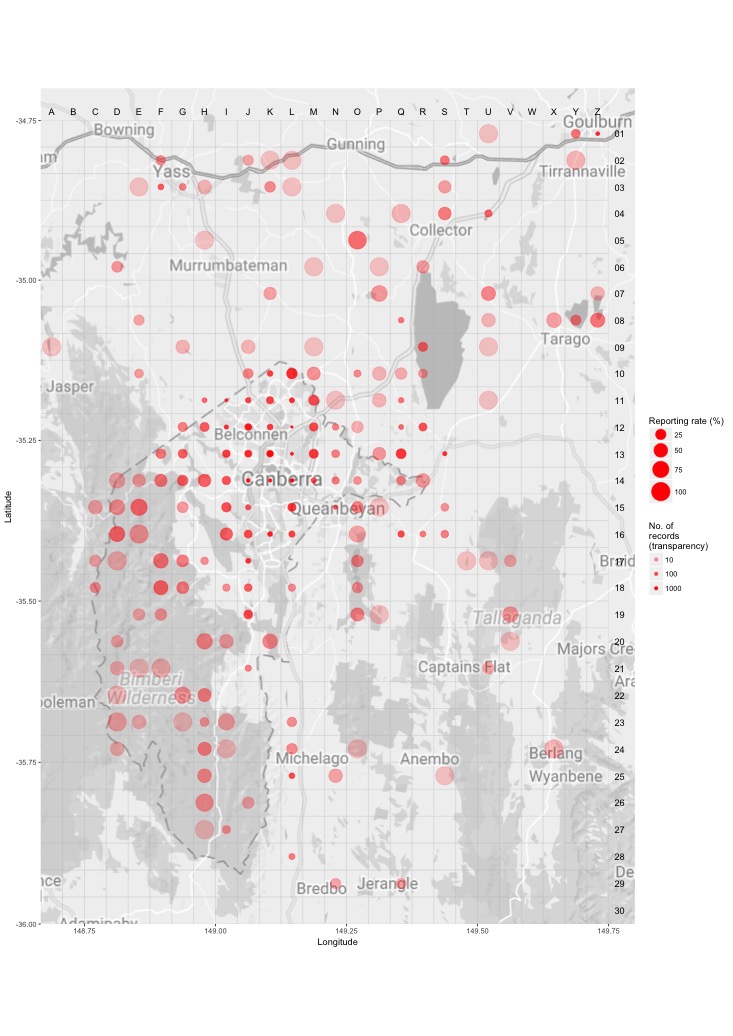
Distribution - all years
This map shows the observed distribution of the Grey Shrike-thrush for all years.
The red circles are the grid cells where Grey Shrike-thrush have been reported.
The transparency of the red circles indicate how many surveys sheets were submitted for that grid cell; the darker the red the more reliable the data. Of the 703 grid cells with reports, 55 had only one sheet; an example is grid number A5.
The size of the circle represents the reporting rate. The maximum reporting rate for Grey Shrike-thrush was 100.0% (eg grid number A15) and the minimum was 0.4% (eg grid number I6). 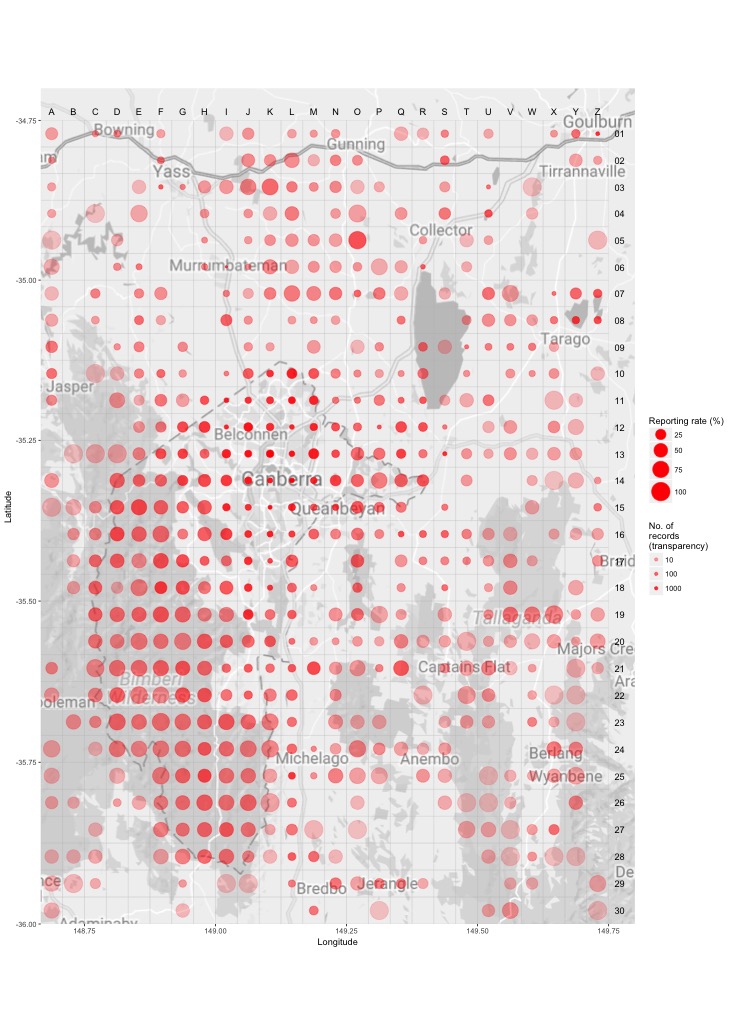
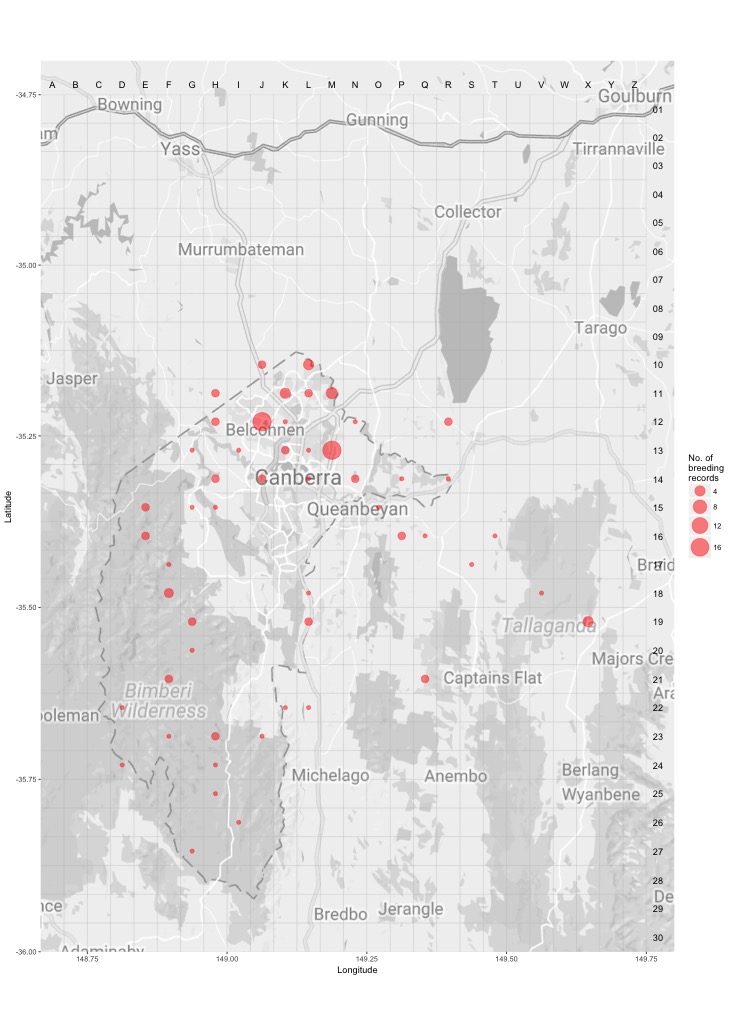
Breeding map
Breeding - 2017
This map shows the breeding distribution of the Grey Shrike-thrush for 2017.
The red circles are the grid cells where breeding activity for Grey Shrike-thrush have been reported.
The size of the circle represents the number of reports. 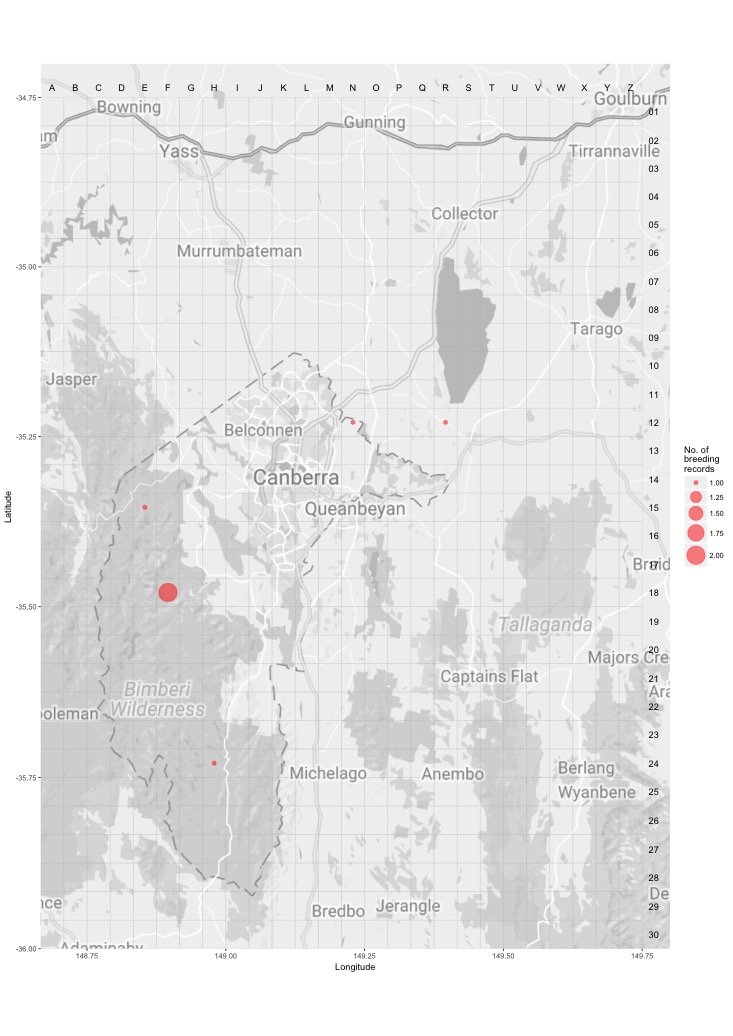
Breeding - all years
This map shows the breeding distribution of the Grey Shrike-thrush for all years.
The red circles are the grid cells where breeding activity for Grey Shrike-thrush have been reported.
The size of the circle represents the number of reports.